Scale
When things get larger, more complex, or more inclusive, we do not necessarily get more of the same, in a simple additive way, like adding more water to a lake. Sometimes the change triggers the emergence of new and unpredictable structures, functions, and properties – like the evolution of consciousness in the brains of vertebrates.
The world
One outstanding example of the emergence of novelty in the world is the gradual development of consciousness and self-awareness that occurred in the evolution of the vertebrates. This is an especially clear example, but of course there were many other kinds of biological novelty that arose during organic evolution.
Human communities are another obvious example. As populations increase and spread out, a broader range of resources can be accessed. New possibilities of scale then emerge. So, for example, the construction of ocean-going galleons allowed societies to penetrate regions they had never experienced before, something that could not have been achieved by just ten or so people. Today our computers are manufactured using expertise and materials that are sourced from around the world.
Explanation
To understand and explain the world we make assumptions that are not founded in science; they are more philosophical. It seems that we cannot understand and explain the world ‘all-at-once’ as if there were just one scale, the scale of everything altogether;[2] it is just too complicated. To provide explanations we divide the world into different scales and we give these scales their own internal properties and dynamics, their own scientific theories, principles, and terminology. These scales are probably better known as ‘integrative levels’ or ‘hierarchical levels of organization’. This is a difficult idea, but it is reflected, say, in the academic disciplines of physics, biology, and sociology which, though having much in common, also have their own set of rules and procedures.
Referred to here as ‘scale’ and elsewhere on this web site as ‘aspect’, the crucial point is that for each ‘scale’, we choose different factors as being important in any explanations that we give. Examples would be the way that we do not explain social phenomena in terms of physics and chemistry.
Thresholds
Occasionally there is a critical mass or degree of complexity that triggers novelty as when, for example, the melting of the Earth’s ice caps suddenly triggers a change in the circulation patterns of ocean currents. Sudden jumps or transitions like this are sometimes a matter of scale, of size or degree of complexity.
Historian Ian Morris thinks that transitions in form of social organization were triggered by the use of new and different forms of energy. Eating only wild plants, the likelihood of humans developing settled communities with elaborate technology was much less probable than when they established farms of domesticated animals and cereals(whose grain could be stored for later use. Again, the use of fossil fuels facilitated the development of technologies that would have been highly unlikely in communities based strictly on farming.
So, as societies become more complex, so new capacities emerge that were not possible (or unlikely) before. Today a computer requires materials and expertise that are sourced from around the world. This is a consequence of scale. Conversely, as the scale reduces so does what can be achieved.
Temporal scale
As humans, we are cognitively attuned to a human time scale. This is part of our biological adaptation to the length (spatial metaphor) of a human lifetime, a psychological evolutionary adaptation to our historical survival on planet Earth. Our general sense of ‘long’ and ‘short’ time intervals, and our mental framing of history, is judged in relation to a human lifetime: this is part of our human nature. However, we can choose the scale at which we wish to work. The scale of the universe is 13 billion years; the scale of Earth is 4.5 billion years; the scale of mammals is 70 million years; the scale of hominids is 4 million years; the scale of human history is 200,000 years; the scale of agrarian and urban civilizations is 5,000 years; the scale of ‘national history’ is few centuries long; the scale of human life is one hundred years at the most.
Clearly the factors we regard as important in history relate to the scale of place and time that is under consideration and Big History encourages us to step outside our human time scale to consider time at the universal scale.
Sustainability & scale
One difficulty with the idea of sustainability is that it is a broad concept that can be applied to all aspects of life – over short and long time frames, over large and small areas, to one person or many. This means that there can be numerous approaches to its management . . . it can be tackled at all scales of social organization and administration.
So, for example, sustainability can be managed at the global scale through the recommendations of United Nations organizations. But then, at the other extreme, we can contribute by modifying our own individual behavior.
To illustrate how this might work we can consider some management policies that apply at the global, national, and individual scales.
Global
To make progress requires international cooperation in the development of policies and practical action.
It is from the United Nations that the we have the idea of ‘sustainability’ as a collective program for the future. International commitment was expressed through the Brundtland Report (1987), the Millennium Declaration (2000), Millennium Development Goals, Agenda 21, Agenda 2030, and the Earth Charter – all accentuating the need for an international response to address social, economic and environmental concerns as the world community aspires to high-consumption western lifestyles.
Biodiversity loss is addressed by the 196-nation Convention on Biological Diversity and the Strategic Plan for Biodiversity 2011-2020 which includes the Aichi Biodiversity Targets and Nagoya Protocol.
Finding accepted evidence-based research on which to base international policy decisions has also proved difficult. Policymakers require the best possible and impartial scientific advice to guide their decisions at an international level. Conflicting or highly technical guidance does not produce practical outcomes. Statements on the condition of the planet have been produced by the World Wildlife Fund (WWF) and other organisations. Climate change, being a contentious issue, is a good example. Ultimately it is the combined opinions of the world’s best climate scientists, the International Panel on Climate Change (IPCC) that carries the most authority.
A similar consortium of international scientists was formed in 2012 to produce policy advice on global biodiversity and environmental matters, the Intergovernmental Platform on Biodiversity and Ecosystem Services, the IPBES. In May 2019 there were 132 signatories.
The IPBES Global Assessment Report on Biodiversity and Ecosystem Services is the most comprehensive world environment report ever completed. It is the first intergovernmental report of its kind and builds on the landmark Millennium Ecosystem Assessment of 2005, introducing innovative ways of evaluating evidence. Compiled by 145 expert authors from 50 countries over the past three years with inputs from another 310 contributing authors, the Report assesses changes over the past five decades, providing a comprehensive picture of the relationship between economic development pathways and their impacts on nature. It also offers a range of possible scenarios for the coming decades.
Based on the systematic review of about 15,000 scientific and government sources, the Report also draws (for the first time ever at this scale) on indigenous and local knowledge, particularly addressing issues relevant to Indigenous Peoples and Local Communities. A recent policy was released in May 2019.
Specifically on plants there are global initiatives to safeguard plant diversity through the 2020 Global Strategy for Plant Conservation and Global Taxonomy Initiatives. Part of this involves biosecurity concerns and threatened plants addressed by the IUCN, CITES/TRAFFIC and other institutions like the FairWild standard and the BGCI Red Listing of European trees. Botanic gardens can encourage the protection of natural habitats and maintain germ plasm in seed Banks and conservation collections while guarding against the international spread of disease and dispersal of potentially invasive plants through incautious exchange. The effects of climate change are being monitored through the International Phenological Gardens Network and other initiatives.
National scale
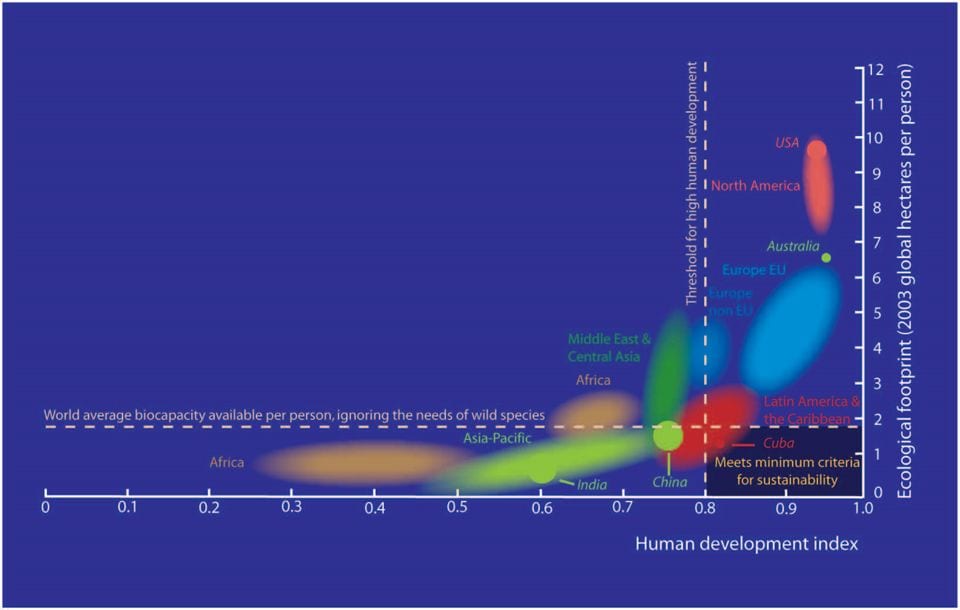
The associated graph gives us a perspective on global sustainability by country. One axis plots the United Nations Human Development Index which considers life expectancy, literacy, education, standard of living and GDP per capita as measurable parameters of human well-being. The USA, Europe, Australia, and other ‘developed’ nations have high scores while Africa, India, parts of the Asia-Pacific, Latin America and the Caribbean do not meet desired standards. The other axis plots the Ecological Footprint as a measure of the environmental impact of different nations. Here the consumption of the ‘developed’ nations far exceeds the carrying capacity of the Earth. In the bottom right hand corner of the graph is the virtually empty box for countries that maintain human wellbeing without their consumption exceeding the Earth’s carrying capacity extrapolated across the global population.
The principle of seeking maximum wellbeing while living within the means of the planet is just as true of the individual as it is of a nation.

Meeting the global ecological sustainability challenge
Countries on the lhs of the chart are living within global sustainability limits but below acceptable living standards
Countries on the rhs have high living standards but are consuming beyond planetary capacity
At the global scale we need to reduce the ecological footprint of affluent countries and raise the living standards of poor countries without increasing resource use beyond globally sustainable levels
Chart adapted by Rob Cross from Living Planet Report of 2006 (essentially the same in 2020).
Individual scale
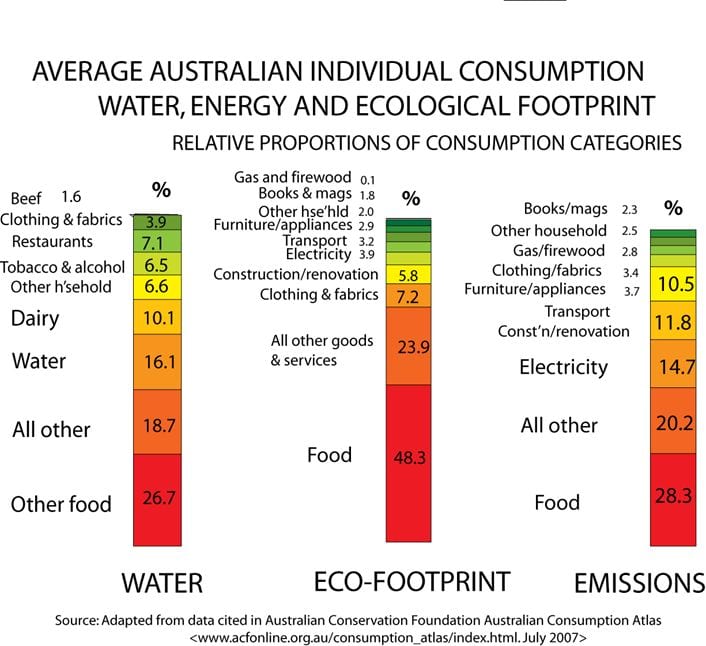
Each of us has a role to play as a global citizen contributing to the improved management of planet Earth. We can minimize our environmental impact by being discerning consumers and by trying to understand the environmenta impacts of the goods and services that we use. The chart showing the average individual resource consumption in Australia gives a breakdown of those consumer products that contribute to individual emissions, water consumption, and Ecological Footprint.

Individual Ecological Sustainability
Breakdown of resource consumption of the average Australian
Food accounts for 46% of water use, 28% of emissions, and 48% of the Ecological Footprint.
Total environmental impact depends on the sum of the environmental impacts of the individual items of consumption.
Key points
- Increasing size, complexity or inclusiveness sometimes results in the emergence of new properties
- The crossing of physical thresholds can result in major, and often unpredictable, physical changes
- The emergence of novelties may be triggered by the crossing of a threshold or boundary
- We understand and explain scale using scientific research combined with a (metaphysical) system of explanation concerning the nature of reality
- Sustainability may be managed over many scales: from short to long time frames, over large and small areas, as applied to one person or many.
Stunning New Universe Fly-Through
VideoFromSpace – 2018 – 5:44
Emergence Theory
Systems Innovation – 2016 – 3:40
Nature vs Humans – Paul Maccready
The Maccready Explosion
TED1998 – 1998 – 22:31
—
First published on the internet – 1 March 2019
Meeting the sustainability challenge – at the scale of countries


